Product

One platform for all your nonprofit data needs

Surveys, spreadsheets, CRMs and case tools — brought together, cleaned, and connected in one place your whole team can trust.

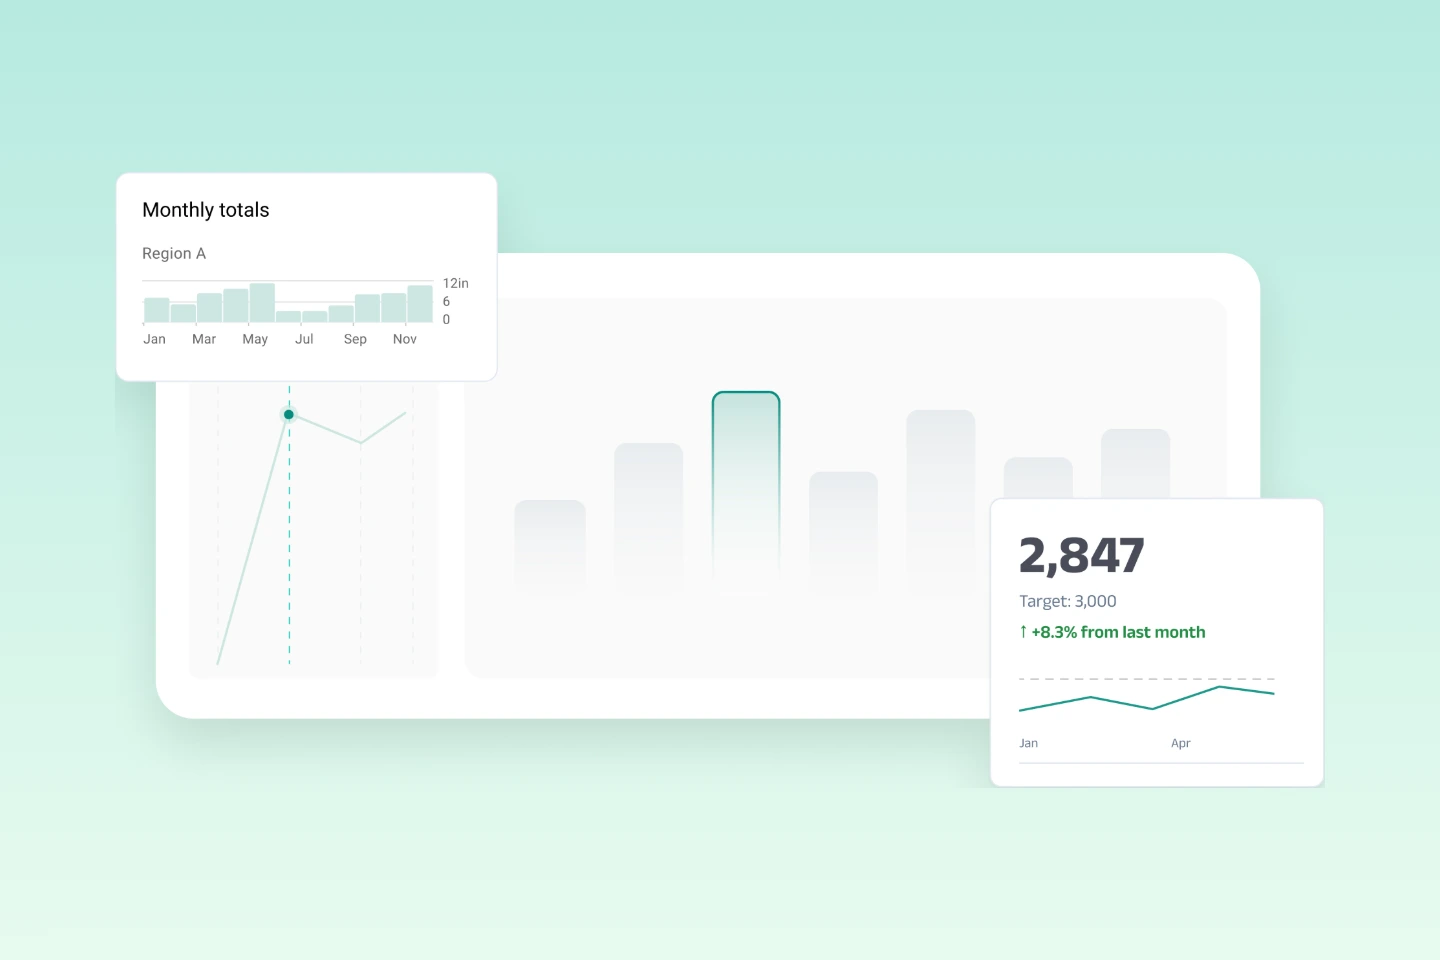
A Dalgo dashboard illustration — programme metrics and monthly totals at a glance
Two things stood out about Dalgo 2.0. First, the map of the country — you can drill down, and as NGOs we can use that for so many representations. Second, sharing dashboards publicly: it’s much easier to just give people a link than to keep generating logins for every layer. That’s a really big upgrade.
Chetan PruthiProduct Manager, Make A Difference
Chetan Pruthi of Make A Difference

See Dalgo in action

Click through Dalgo's real product screens — connect, clean, and visualize — no signup needed.

insights.dalgo.org/impact
Connect page - empty state
Choose your data source
Configure Google Sheets source
Connection syncing - Locked status
Connection synced - Success
Clean overview - DBT Repository connected
Workflow canvas with source table tree
Cast node added to canvas with Create Table and Add Function options
Casting the AQI column to a numeric type
Naming the output table and choosing a schema
Choosing a directory under models for the new table
Running the workflow - dbt clean executing
Completed production pipeline with multiple transform steps and preview data
Create a new chart - choose a dataset
Configure the chart type, axis, and metrics
Chart styling options - orientation, labels, legend
Saved chart with interactive tooltip showing values
Empty dashboard canvas with Add Chart, Add KPI, Add Text buttons
Add Chart modal with a grid of saved charts to choose from
Add KPI modal with a grid of saved KPIs to choose from
Dashboard canvas with KPI and chart placed, drag to move handle visible
Dashboard with a text heading block added above the KPI and chart
Create Dashboard Filter modal - naming a District dropdown filter
District filter dropdown open showing a searchable list of values
Filter applied to Agra - chart updates to show only that district
Dashboard in viewer mode with Edit Dashboard and Share buttons
Public read-only view of the dashboard, powered by Dalgo branding

Capabilities

Dalgo for every part of your data workflow

One platform for everything — from data integration to data that speaks to your impact.

Your programs generate data in a dozen places — surveys, chatbots, spreadsheets, case-management tools. Dalgo consolidates all of it into a data warehouse that belongs to your organisation, cleaned and ready, so every review starts with numbers your team can trust.

  • Custom-built connectors for the tools NGOs already use — KoboToolbox, MGrant, ODK, SurveyCTO, CommCare, Avni, Glific — plus 600+ more sources via Airbyte
  • Data lands in your own warehouse — it stays yours. Dalgo processes it only to run the service you signed up for.
  • Automated cleaning and transformation, running on a schedule with no manual crunching
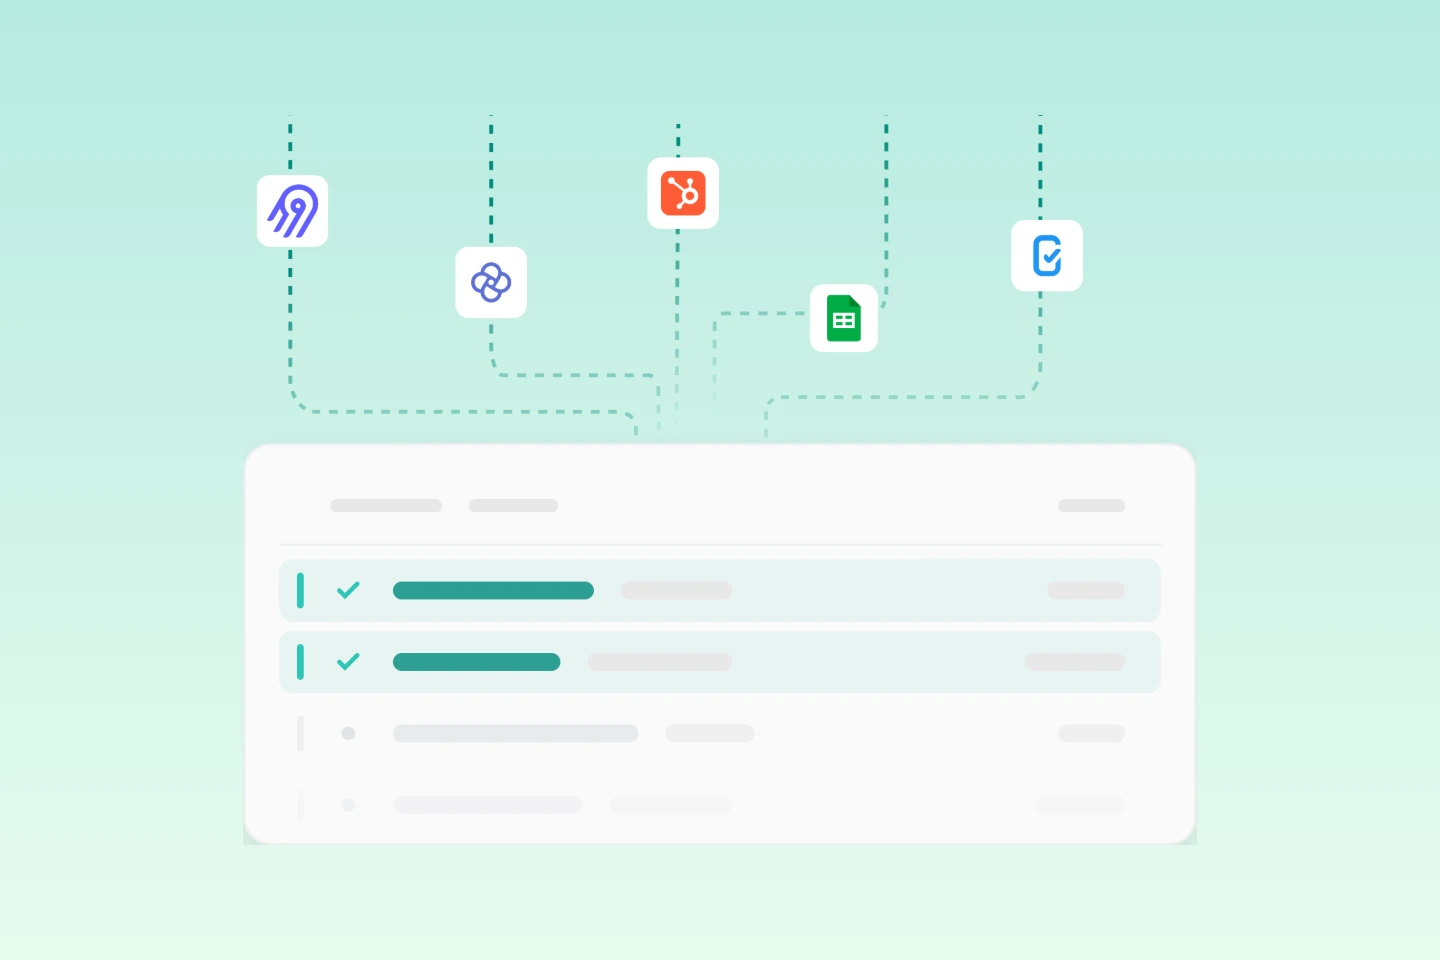
Workflow — every source syncing into your own warehouse

Live dashboards

Explore dashboards powered by Dalgo

Live dashboards and reports nonprofits run on Dalgo today — including native examples built directly in the platform.

Noora Health

Equipping families with the skills to care for patients at the bedside.

Dalgo Native

Dalgo Native Dashboard

A live, interactive dashboard built directly in Dalgo — explore the native experience end to end.

Dalgo Native

Dalgo Native Report

A shareable report generated in Dalgo, frozen to a reporting period and opened from a single link.

Trusted by the sector

What nonprofits say about Dalgo

Hear from the teams who run their data on Dalgo every day.

"It's thrilling to finally see an affordable service built on open-source software to support non-profits in making evidence-based decisions."

Jacob HugheyCore Team Member, The Agency Fund
"The introduction of the dashboard has been a game-changer for our team. It has significantly reduced the time spent on compiling data manually, allowing us to focus more on analysis and decision-making rather than repetitive tasks."
Vinodhini UmashankarAssociate Director – Monitoring & Evaluation, Ummeed Child Development Center
"Caseworkers now save close to three hours every week on navigation and report generation, with reports that previously took half a day now generated in just a few minutes."
Nicholas Ong’injoMEL Team, SHOFCO (Shining Hope for Communities)