From Data Burden to Strategic Insight: Transforming data across countries with Dalgo
STiR Education works with teachers, principals and officials to improve learning. While STiR worked with the Dalgo team, their monitoring and evaluation (M&E) team stopped building every review by hand, and leadership, design and donor teams used the data to decide and report for themselves. STiR could put more of their time into their mission.
Key Highlights
STiR Education works to improve learning outcomes for children by building intrinsic motivation in teachers and officials, and their programs have improved engagement and learning outcomes for over 12 million children. They worked with the Dalgo team on the platform plus consulting: 100 hours of consulting to understand their needs and build the solutions, then support. Their data came from POI Mapper and SurveyCTO (mobile data collection tools), with dashboards on Superset (an open-source dashboard tool).
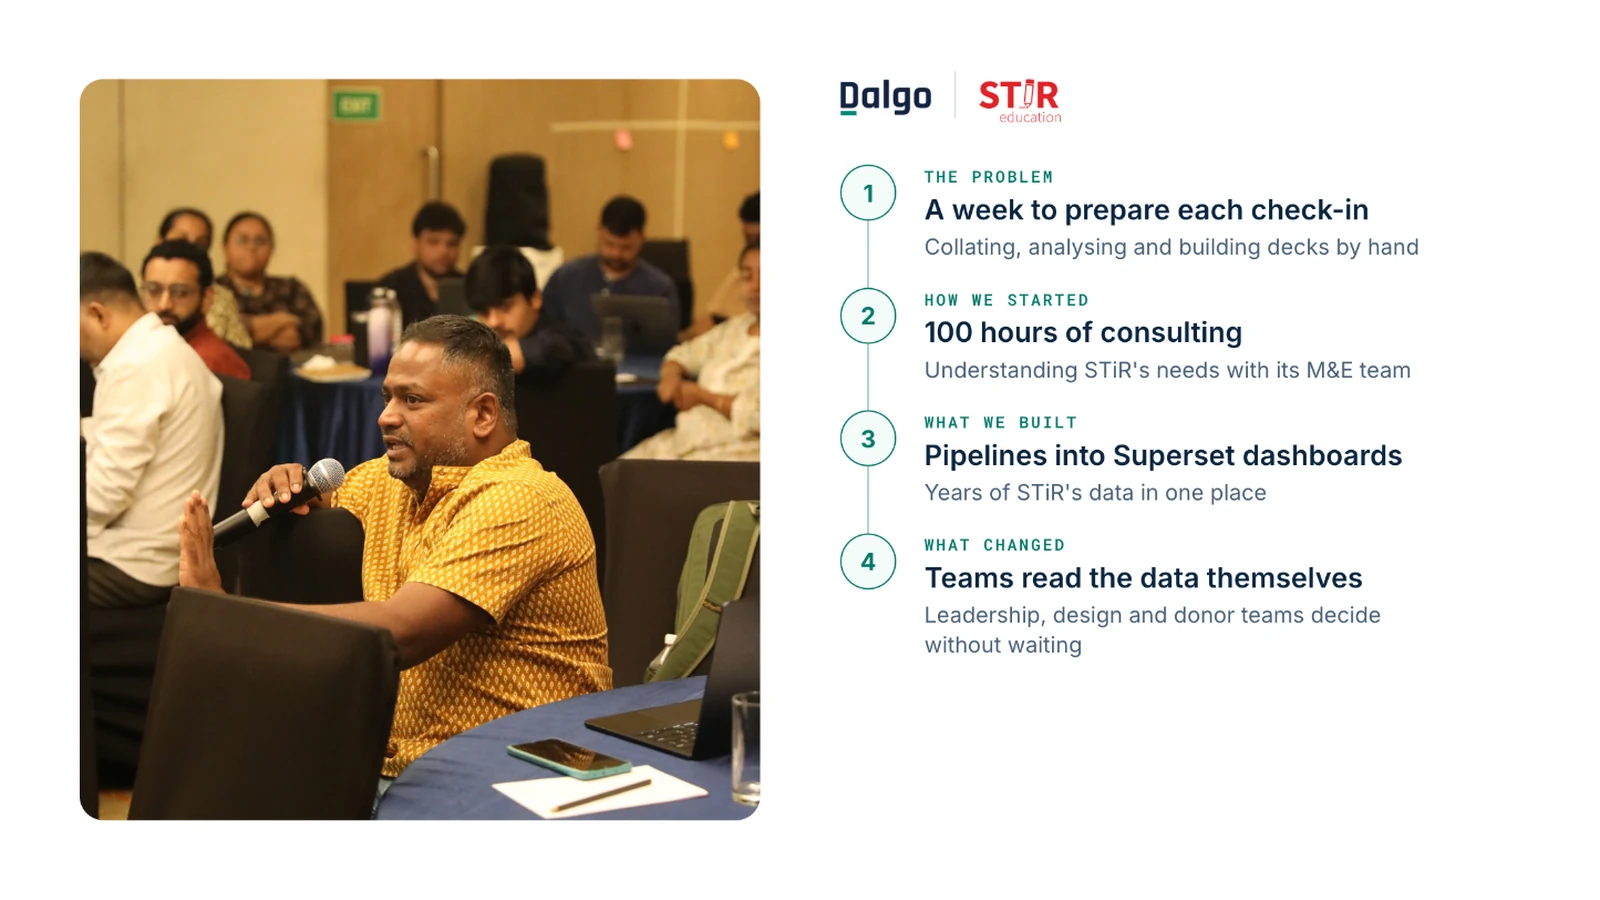
- Consulting first. The Dalgo team provided 100 hours of consulting to understand STiR's needs and implement the solutions.
- Pipelines and dashboards. Data from STiR's collection tools flowed through automated pipelines into Superset dashboards that held years of data.
- Skills that stay. No formal course: the Dalgo team helped STiR staff understand the processes and build basic troubleshooting skills, with support on Discord.
| Result | What changed |
|---|---|
| Teams stopped waiting for M&E | Leadership, design and donor teams used the dashboard for their own decisions and reports |
| M&E as enablers | The team moved to improving data quality and training program teams to use data |
| 100 hours of consulting | To understand STiR's needs and build the solutions with their team |
| A week → an hour | Preparing a monthly check-in with the program teams |
The challenge
STiR's programs depend on behavioural data: what teachers, principals and officials do, collected often and used to change the program design. Preparing that data for each review fell to a small M&E team.
- A week per check-in. Monthly and quarterly check-ins took about a week to collate the data, analyse it and prepare decks the program teams could read, so teams could not get timely insights to plan their next actions.
- A dashboard that did not fit. STiR had a dashboard, but it was not flexible enough for the teams, so the preparation continued by hand.
- Everyone waited on M&E. Program teams depended on the M&E team to crunch the numbers before they could decide.
“Compiling the data into a presentable form so that teams could understand and interpret it, and then iterate on design, was a challenge. It involved a lot of time and effort.”
The transformation
The dashboard held years of STiR's data, and each team used it for their own decisions.
Senior leadership. Tracked performance trends across the years, aligned their decisions with design outcomes, and reported to the board and donors with up-to-date visuals.
Design team. Used the same data to see the effect of each change to the program design and decide what to change next.
Donor partnerships. Drew on the multi-year data for proposals, donor reports and newsletters. When donors or government asked how the program was working, the team could focus on the story instead of rebuilding the data.
M&E team. Preparing a monthly check-in took an hour at most, down from about a week. The team spent their time refining data collection tools, improving data quality and training program teams to use data on their own.
“So irrespective of the questions that come our way — whether from donors or the government — we’re now able to focus much more on building the story, rather than spending time working on the data to build that story.”
What it showed
STiR’s experience showed what changes when data work stops competing with program work. Arun, a senior manager at STiR Education, observed that processing data is technical work, and that NGOs find it difficult to sustain and motivate staff in such roles. Once automated pipelines handled most of that work at STiR, the M&E team moved from supplying data to building data literacy across the organisation, and teams could give their time, in Arun’s words, to “what needs to be done — what the mission of the organization is — rather than spending time and resources on the data itself.”