Lessons from SHRI: running 20 public toilets on data the whole team can trust
Sanitation and Health Rights in India (SHRI) runs free public toilets across Bihar and Jharkhand, India. The Dalgo team worked with them to turn the daily forms their facility staff fill in into automated reports and a public dashboard. This helps teams identify and resolve problems faster, while giving funders, government officials, and communities access to the same reliable data.
Key Highlights
The Dalgo team worked with SHRI to build their reporting system. Facility staff kept the four Kobo mobile data-collection forms they already used; the system connected them, so every submission flowed into reports and dashboards without anyone rebuilding them.
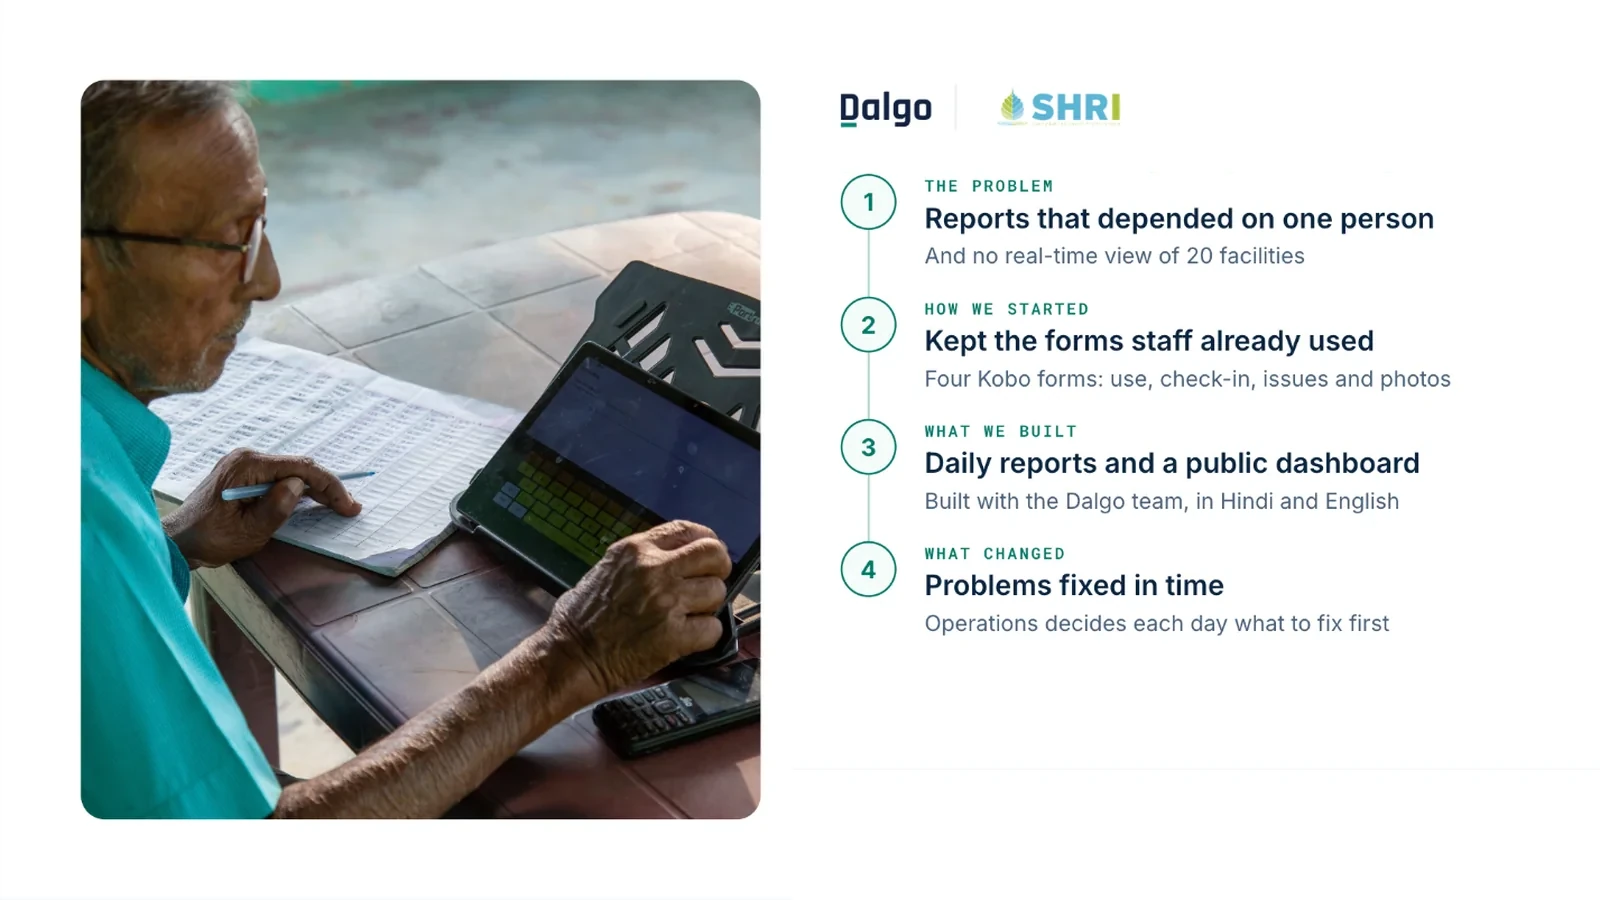
- Daily use. People-counting machines on the men's and women's sides, logged by staff each evening, with unusually high or low days easy to spot.
- Staff check-in. A barcode scan on each staff ID card marked attendance at every facility.
- Issue reporting. Twice a day, once per shift, staff logged electrical, plumbing, infrastructure, supply, cleanliness and technology issues.
- Weekly photos. Timestamped, geotagged photos of every facility, filterable by facility and date.
“We wouldn't have [this impact] without our staff, who are now so skilled at using the digital tools that the Dalgo team helped us build.”
| Result | What changed |
|---|---|
| Problems fixed in time | Operations sees each facility's use, issues and staff check-ins every day and decides what to fix |
| Every day | Public dashboard refresh for funders, government and community, in Hindi and English |
| 99% uptime | Days facilities are open and working, now tracked daily |
| 5–7 hrs a week → automated | Report preparation, which once needed one person's know-how |
The challenge
Consistent toilet use depended on every stall staying clean and working, and on SHRI knowing which facilities had problems in time to fix them. With thousands of users a day, that became harder to manage with every facility they added.
“When you operate dozens of these facilities with thousands of people using them every day, making sure all the facilities and stalls are high quality becomes complicated.”
- Reports that depended on one person. Preparing reports took 5 to 7 hours a week and needed specialist knowledge that one person held.
- No daily view of the facilities. The team could not see in real time what was happening at each facility, so they could not tell which facilities needed attention in time to fix problems.
- A dashboard built on manual entries. The public dashboard showed only what staff had entered by hand, so it was only as current as the last entry.
The transformation
Every Kobo form now feeds a daily report and a public dashboard, so each team acts on the same picture of all 20 facilities.
Operations and leadership. A daily report on use, attendance, issues and photos shows them which problems to fix, how each facility is being used and where quality needs attention. When use drops at a facility, they can match it to the days it was out of service and act quickly to get it open again.
Supervisors. They are able to check whether staff checked in and cleaned at least twice a day, as SHRI's rule requires, at every facility, which holds staff accountable for keeping facilities as clean as SHRI promises.
Facility staff. The daily use report is visual enough for facility staff to read, so they see the same daily numbers as management, including unusually high or low days at their own facility, and stay informed about the issues there so they can fix them in time.
Funders, government and community. The public dashboard once showed whatever staff had entered. It now updates every day, in Hindi and English, with maintenance logs, outages and staff attendance, so anyone can check that facilities are kept as clean and working as SHRI promises. SHRI says this gives people confidence in their transparent operations.
The weekly report that took 5 to 7 hours by hand is now generated automatically, and the system calculates total use, average daily use and cost per use.
“It's like real-time feedback on how our systems are functioning and what changes we need to make based on the data.”
What’s next
SHRI will start monthly random spot checks with district water and sanitation committees to validate their data, and will continue working with the Government of Jharkhand on taking the model to more community toilets, schools and health facilities. With other NGOs, they call this “Shri in a box”.