Lessons from SHOFCO: a live view of program data for every team
The Dalgo team worked with SHOFCO in Kenya to connect data from three tools in one automated pipeline and move caseworkers from paper to digital case tracking. Leadership, monitoring, evaluation and learning (MEL) teams, caseworkers and donors can now make informed decisions from the view they need.
Key Highlights
Shining Hope for Communities (SHOFCO) runs gender, water, sanitation and hygiene (WASH), livelihoods and education programs in Kenya, reaching more than 2.4 million people in over 30 counties. They have worked with the Dalgo team since October 2024, on the platform plus consulting, with more than 40 hours of training. Their data comes from CommCare, Google Sheets and Mobiwater, with dashboards on Superset.
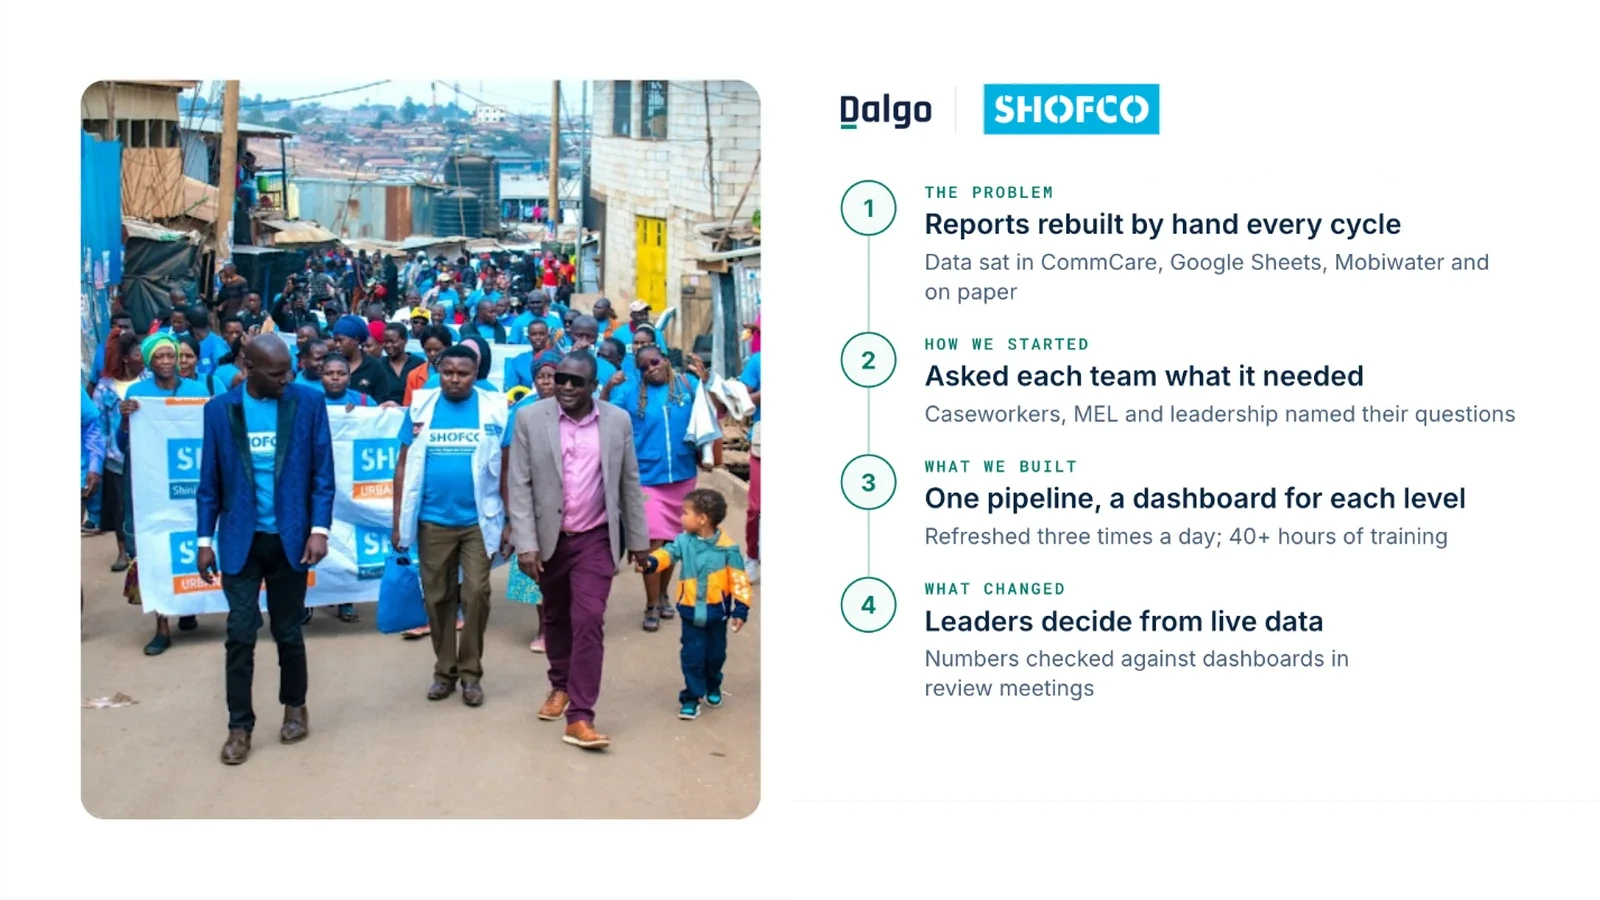
- Designed with each team. The Dalgo team asked caseworkers, the MEL team and leadership which questions they needed answered, then built KPIs for leadership, program tracking for MEL, donor views, and caseload views where each caseworker sees only their assigned cases.
- One pipeline behind it. CommCare (a mobile data collection platform), Google Sheets and Mobiwater (smart meters that record the water supplied) flowed into one store, cleaned on arrival and refreshed three times a day. Programs kept the tools that suited them.
- Skills that stay. Training on dashboards, data models and pipeline troubleshooting, so SHOFCO's own team could take on new requests. Adoption rose once the dashboards were built into caseworkers' routines and caseworkers co-designed features.
| Result | What changed |
|---|---|
| Every team, one live view | Leaders check reported numbers against the dashboards in review meetings |
| 3 times a day | Data refresh, from CommCare to dashboards |
| Months → days | Time to roll out a new dashboard |
| 12+ hrs → ~2 hrs a week | Weekly data cleaning for caseworkers and the MEL team |
The challenge
Each SHOFCO program team collected their own data: gender-based violence (GBV) cases and counselling in Gender, school and scholarship support in Education, water supplied in WASH, and business-skills training in Livelihoods. That data sat in CommCare, Google Sheets, the Mobiwater system and on paper.
- Manual cleaning every cycle. Weekly internal reports and monthly-to-bi-annual donor reports meant downloading, cleaning and merging by hand: up to four hours for program staff and up to a whole day for the MEL team.
- Static reports. Reports were prepared by hand and could not be filtered, so a follow-up question, such as how women fared on a result, went back to the MEL team to redo the analysis.
- A 2023 stack that did not fit. CommCare did not suit every program, the setup depended on paid external retainers, and Power BI licences ruled out field-level dashboards.
“We were not able to do things in real time, because we had to wait until the end of the week or the end of the month for us to go into the system, download, clean, and analyze.”
The transformation
Every team now works from the same live data, and each makes an informed decision based on their objective.
Leadership. Reviews used to wait for end-of-week or end-of-month reports. Now leaders check reported numbers against the dashboards in review meetings and question gaps on the spot.
“When you are reporting on a certain thing, [leaders] make reference: 'let me check on the dashboard' — and if it's not matching, then they'll ask questions then and there.”
Program managers. They once reported a single total of participants reached. Now they check each caseworker's progress against Rights of Children (ROC) club targets.
MEL team. Weekly data cleaning for caseworkers and the team fell from more than 12 hours to about 2, and that time now goes to validating data. Program staff can now split a result by gender or region themselves, where they once had to ask the MEL team to redo the analysis.
Caseworkers. They moved from memory, sticky notes and wall charts to their own caseload, tracked digitally. Each month they track open, resolved and closed cases and see how long each case has stayed open, so they can decide which cases need a follow-up.
What’s next
Dashboards are live for Gender, WASH, Livelihoods and Education. The SHOFCO Urban Network, libraries and financial cooperative will come onto Dalgo next.