Baala: Scattered menstrual health data, brought into one place
Baala works on menstrual health in India. With the Dalgo team, they brought the data from 25 Kobo forms and their Google Sheets into one pipeline. Their monitoring and evaluation (M&E) team can now compare trends across programs and regions, and is learning to run the pipeline themselves.
Key Highlights
Baala works to make menstrual health and sexual and reproductive health accessible and stigma-free in India. They build curriculums, train local champions in communities and organisations, and build evidence for advocacy on a subject people rarely talk about. They have worked with the Dalgo team since July 2025, on the platform plus consulting: a data warehouse, pipelines for 25 Kobo forms, and twice-weekly training in SQL, Python and dbt. Their data comes from Kobo Toolbox (mobile survey forms) and Google Sheets, with dashboards in Looker Studio (Google’s dashboard tool).
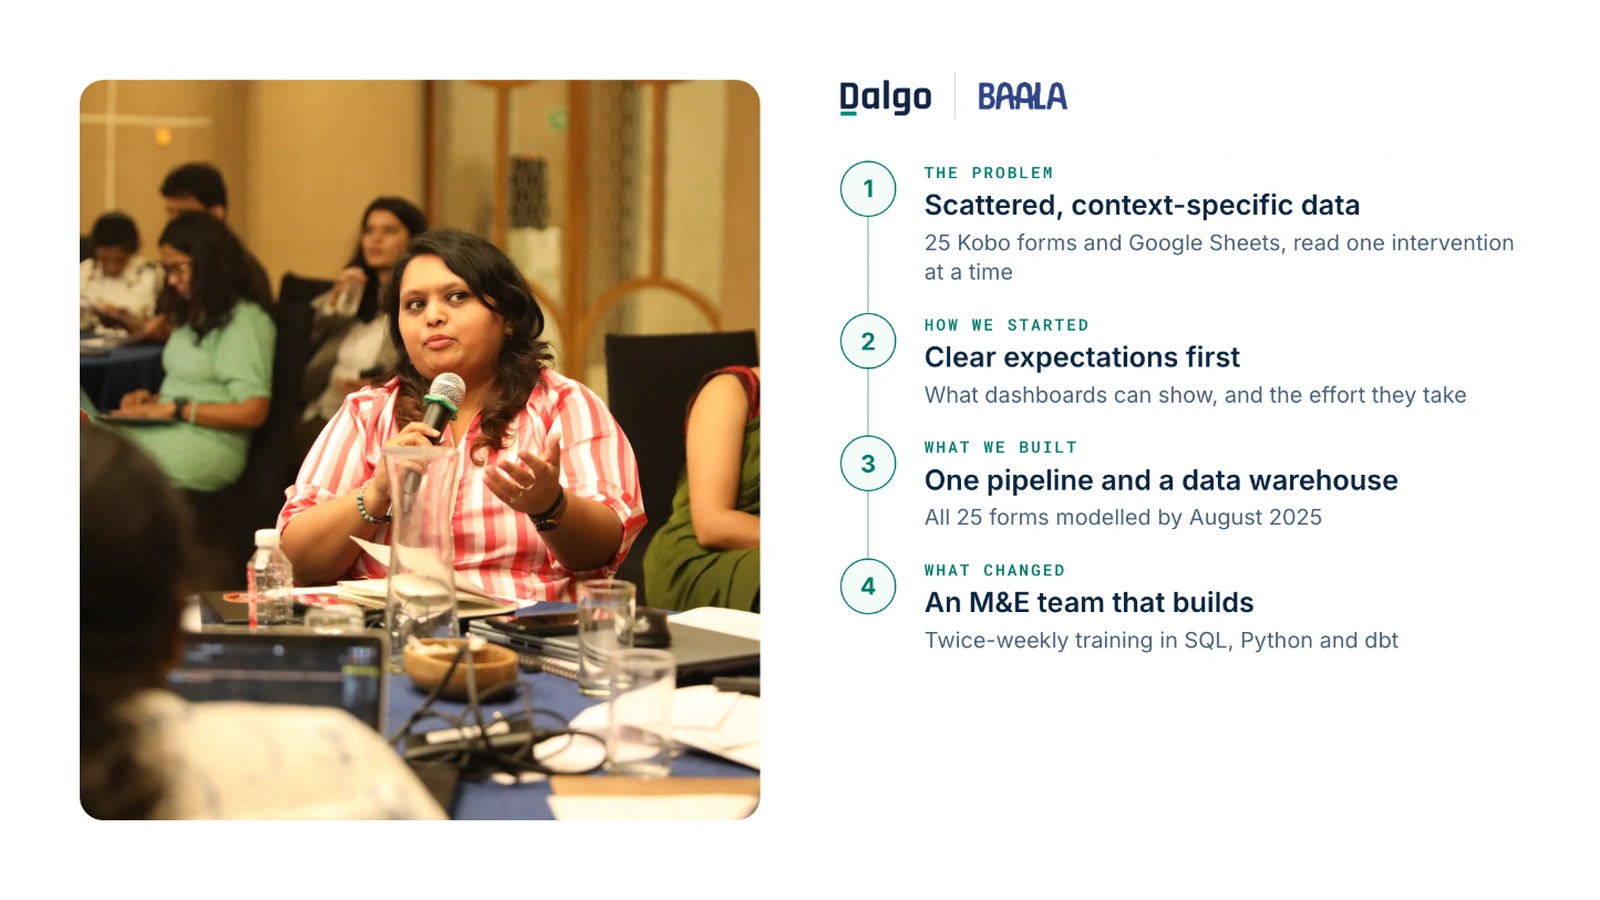
- Collection left as it was. The Dalgo team drew on their work with other NGOs to show what dashboards could look like and the effort they would take. Baala decided to keep their data collection as it was and change only the M&E layer of the pipeline, so field teams did not have to change how they work.
- One pipeline. The Dalgo team set up a data warehouse, with ingestion from Kobo Toolbox and Google Sheets, all 25 forms modelled, and every source in one place by September 2025.
- Skills that stay. From late 2025, the Dalgo team ran twice-weekly training in SQL (the language used to query databases), Python (a programming language) and dbt (a tool for cleaning and modelling data), and documented the data models, so Baala's M&E team could connect new forms themselves.
“I think what worked for us is that we are not changing the way people collect data. So at the moment we're using Dalgo to change the second level of the pipeline, which is more M&E-driven.”
| Result | What changed |
|---|---|
| Trends across programs and regions | The M&E team can compare programs and regions, with 25 Kobo forms and Google Sheets in one pipeline |
| An M&E team that builds | Twice-weekly training in SQL, Python and dbt, with documented models |
The challenge
Baala's evidence work aimed, in the words of Karishma Navalkar, Monitoring and Evaluation Lead, to "make this invisible visible". They collected their data in many different settings, through 25 Kobo forms and Google Sheets. The more specific each context, the more scattered the data became.
- No single picture. Each intervention's data sat on its own, so the team could not compare trends across programs or geographies, or see their work as a whole.
“Right now our major challenge is that our data is very scattered. The more context-specific it is, the more scattered the data looks. So we have data coming in from rural areas, very rural remote areas, as well as from very urban workspaces, as well as from different kinds of schools … we are trying to make sense of it by getting everything together and seeing it as a holistic picture, and not just as a singular intervention.”
The transformation
Baala's data now sits in one place, and their M&E team is learning to work with it directly.
“Getting everything in one place makes our life much easier, because now we're able to see trends across programs, across different geographies.”
What’s next
Baala will next refine their dashboards, starting with a menstrual health dashboard for policy makers, other organisations and their own team. The insights will flow back to their field teams, so they collect only the data they need. They also plan to share their data with partners across the menstrual health ecosystem and invite them to contribute.