Lessons from Antarang: from multiple Excel sheets to dashboards every team can trust
Antarang Foundation, a career-guidance nonprofit in Mumbai, India, replaced data from multiple sources with one automated pipeline, giving program and donor teams a shared view of their work from which to make informed decisions, with dashboards refreshed every 24 hours.
Key Highlights
Antarang Foundation, based in Mumbai, India, runs career guidance for students in grades 9 to 12, mostly in government schools, and reaches more than 1 lakh (100,000) students a year. They have used Dalgo since 2023, after a six-month evaluation in which the Dalgo team answered their questions on the transition. Their dashboards run in Looker Studio, Google’s reporting tool.
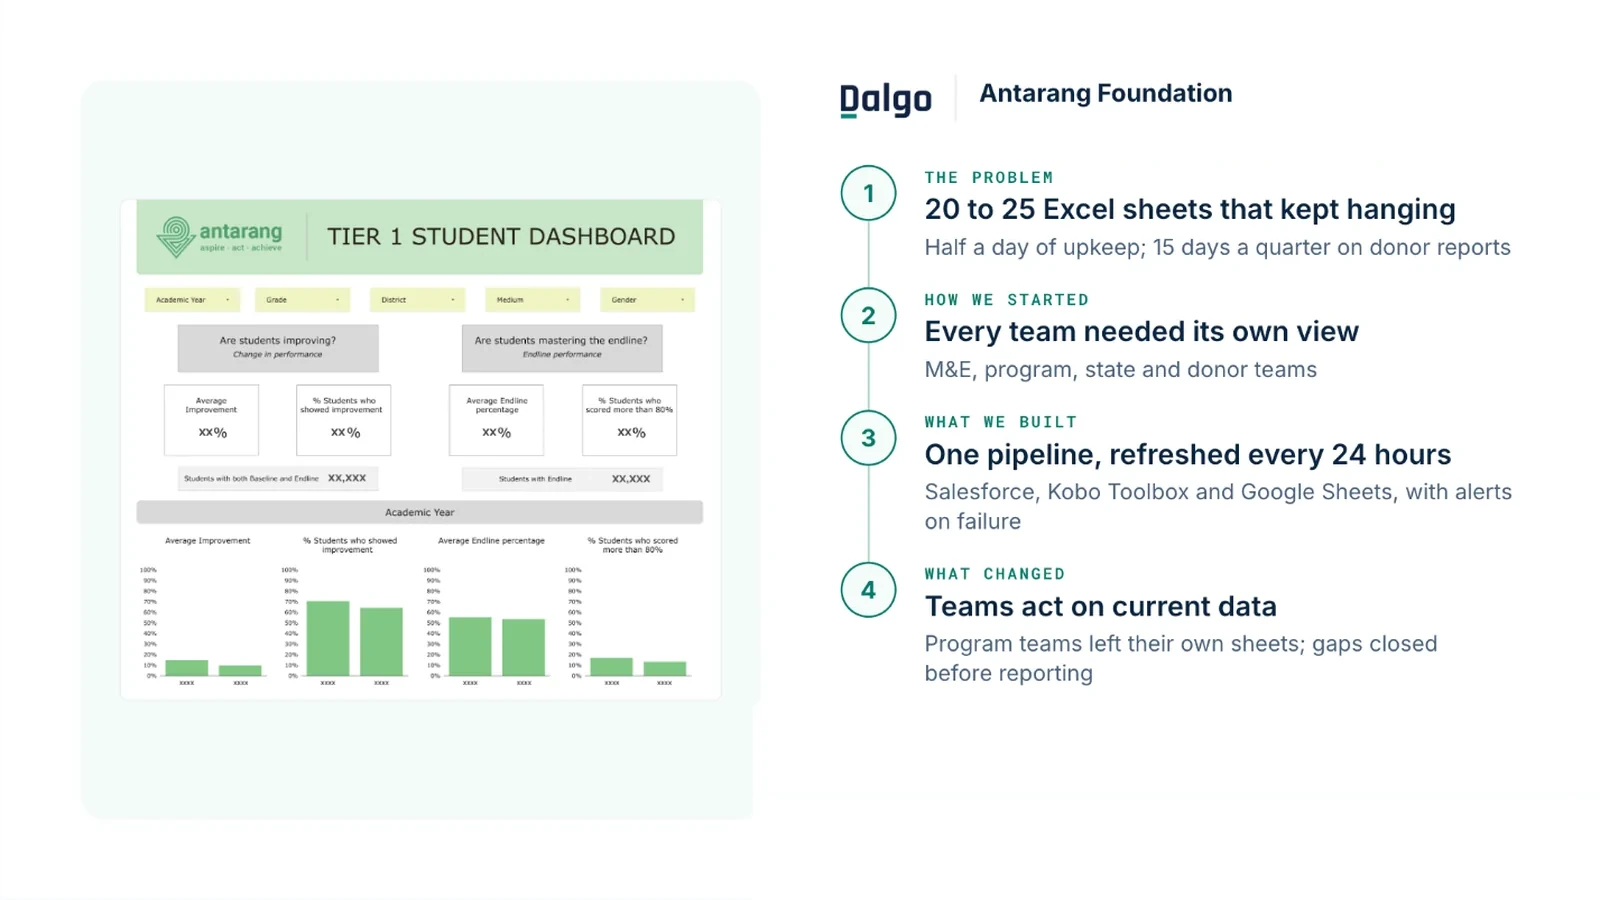
- One pipeline. Data from Salesforce (the database holding student and program records), Kobo Toolbox (mobile surveys) and Google Sheets was pulled in automatically, reshaped into ready-made tables for the dashboards, and refreshed every 24 hours.
- Built around the program's questions. Goalkeep, the implementation partner, built the pipeline and data models around the program's key questions, such as whether students are improving and whether they master the endline (end-of-program) assessment.
- Views by role and place. Antarang's existing monitoring and evaluation (M&E), program and facilitator views and state dashboards moved onto clean tables, and new dashboards were added for reporting to donors and to partners such as government stakeholders and junior colleges.
- Alerts on failure. Notifications were set up so the team knew at once when a pipeline failed.
| Result | What changed |
|---|---|
| Half a day → an hour or two | Daily sheet upkeep, now needed only when a pipeline fails |
| Gaps caught between quarters | Donor reporting team checks data as it refreshes and asks programs to close gaps before reporting |
| 20–25 sheets → 1 pipeline | Salesforce, Kobo Toolbox and Google Sheets in one place |
The challenge
After a 2020-21 shift to working closely with government schools, the volume of student data Antarang stored grew sharply. Their dashboards had run on Excel since 2018-19, and the sheets could not keep up.
- Sheets that took half a day to maintain. One staff member spent half of every working day keeping 20 to 25 sheets refreshed so that dashboards showed current data, and the sheets still froze.
- Management questions waited on manual work. Senior management wanted to track how well programs were working so they could improve student performance, but the dashboard that monitored student growth was slow to load and the data was not in one place.
- Gaps found only at reporting time. Teams waited on one person to prepare the data before they could look at it, so gaps, such as paper answer sheets (OMRs) not yet entered, surfaced only when quarterly donor reports were due.
“[Before Dalgo, at each quarter's donor reporting] every donor's working file needs to be remade at least two or three times … it is quite stressful … I will be working till 8, till 9, beyond my working hours — and that's for everybody in the donor reporting team.”
The transformation
Program teams. They have moved off the Excel sheets they kept on their own and now trust the dashboards enough to act on them: each team reads the indicators for their role and brings those insights into how they run the program.
Donor reporting. The donor reporting team checks the data as it refreshes, spots gaps such as answer sheets not yet entered, works out which program needs to close them, and asks that team to prioritise the work before reporting. Donor and partner dashboards also serve engagement between quarters, such as donor meetings and volunteer events.
Keeping the data current once took half of every working day. It now takes an hour or two, and only when a pipeline fails.
“When the data gets refreshed every 24 hours, somebody is dedicated to looking at the data; they are not dependent on [me] to make it before they can look at it … So anything they figure out, they come back and we can actually reach out to the relevant people saying, hey, this is not done, can you please prioritize this.”
What’s next
Antarang will streamline the data tables they built at the start and will move carefully on new dashboard tools. It took years to get program teams to trust the dashboards they use, so Shaheeda will weigh any switch to Dalgo's own dashboards. Shaheeda's advice to other NGOs: digitise your data, then decide which metrics will show whether a program is working and which strategic decisions the data needs to inform.